Originally posted by xyyman:
quote:Haven't read it yet, but sounds like they've incorporated the Taforalt data. Hopefully the genomes have been released too.
The extent to which prehistoric migrations of farmers influenced the genetic pool of western North Africans remains unclear. Archaeological evidence suggests that the Neolithization process may have happened through the adoption of innovations by local Epipaleolithic communities or by demic diffusion from the Eastern Mediterranean shores or Iberia. Here, we present an analysis of individuals’ genome sequences from Early and Late Neolithic sites in Morocco and from Early Neolithic individuals from southern Iberia. We show that Early Neolithic Moroccans (∼5,000 BCE) are similar to Later Stone Age individuals from the same region and possess an endemic element retained in present-day Maghrebi populations, confirming a long-term genetic continuity in the region. This scenario is consistent with Early Neolithic traditions in North Africa deriving from Epipaleolithic communities that adopted certain agricultural techniques from neighboring populations. Among Eurasian ancient populations, Early Neolithic Moroccans are distantly related to Levantine Natufian hunter-gatherers (∼9,000 BCE) and Pre-Pottery Neolithic farmers (∼6,500 BCE). Late Neolithic (∼3,000 BCE) Moroccans, in contrast, share an Iberian component, supporting theories of trans-Gibraltar gene flow and indicating that Neolithization of North Africa involved both the movement of ideas and people. Lastly, the southern Iberian Early Neolithic samples share the same genetic composition as the Cardial Mediterranean Neolithic culture that reached Iberia ∼5,500 BCE. The cultural and genetic similarities between Iberian and North African Neolithic traditions further reinforce the model of an Iberian migration into the Maghreb.

quote:
West Eurasian populations can be modeled as the admixture
of four different ancestral components (2): Eastern and Western
European hunter-gatherer and Iranian and Levantine Neolithic.
We explored the placement of Moroccan and Southern Iberian
Neolithic samples in this context and compared their genetic
affinities to ancient and present-day West Eurasian and Levant
populations in the Human Origins panel, as well as to other
available aDNA population data. Interestingly, PCA revealed
that IAM individuals are similar to North African Later Stone
Age samples from the Taforalt site in Morocco, dated ∼15,000 y
ago (Fig. 2 and SI Appendix, Supplementary Note 6). When projected,
IAM samples are halfway between Taforalt and modern
North Africans, in the Levantine corner of the PCA space (Fig. 2).
Southern Iberian Neolithic individuals from TOR cluster with
Sardinians and with other Anatolian and European Neolithic
samples. Moreover, KEB samples are placed halfway between the
IAM and Anatolian/European farmer clusters, in close proximity
to Levant aDNA samples and also to Guanche samples (16) (from
the indigenous population of the Canary Islands known to have a
Berber origin; ref. 23). When compared using ADMIXTURE (SI
Appendix, Supplementary Note 7), IAM samples possess ∼100% of
a component partially shared by aDNA samples from the Levant
(Fig. 2). This IAM-like component is observed mainly in modern
North African individuals, following a west-to-east cline, and in
the Guanches. Interestingly, the Early Neolithic individuals from
Iberia form a different cluster from the Anatolian, Aegean, and
European Early Neolithic samples, sharing their main component
with Middle Neolithic/Chalcolithic samples. Lastly, KEB can be
explained as having both IAM-like and Iberian Early Neolithic
components (Fig. 2). The same admixture profile is observed in
the Guanche samples, but the amount of IAM ancestry is consistently
higher in all of the samples. Given that the Guanches
could have originated in a different area of the Maghreb, this
result might suggest that the European Neolithic impact in North
Africa was heterogeneous.
quote:Published
Interestingly, PCA reveals that IAM individuals are different from any aDNA sample studied to date (Figure 2; Supplementary Note 6). When projected, IAM samples are close to modern North Africans, in the Levantine corner of the PCA space (Figure 2). Southern Iberian Neolithic individuals from TOR cluster with Sardinians and with other Anatolian and European Neolithic samples. Moreover, KEB samples are placed halfway between the IAM and Anatolian/European farmer clusters, in close proximity to Levant aDNA samples and also to Guanche samples16, the indigenous population of the Canary Islands known to have a Berber origin
quote:This seems to show a significant correction in a pre-print to published version, something to be aware of in this pre-print versions
Originally posted by Elmaestro:
Interestingly, PCA revealed that IAM individuals are similar to North African Later Stone
Age samples from the Taforalt site in Morocco, dated ∼15,000 y
ago (Fig. 2 and SI Appendix, Supplementary Note 6). When projected,
IAM samples are halfway between Taforalt and modern
North Africans, in the Levantine corner of the PCA space (Fig. 2).
Southern Iberian Neolithic individuals from TOR cluster with
Sardinians and with other Anatolian and European Neolithic
samples. Moreover, KEB samples are placed halfway between the
IAM and Anatolian/European farmer clusters, in close proximity
to Levant aDNA samples and also to Guanche samples (16) (from
the indigenous population of the Canary Islands known to have a
Berber origin; ref. 23). When compared using ADMIXTURE (SI
Appendix, Supplementary Note 7), IAM samples possess ∼100% of
a component partially shared by aDNA samples from the Levant
(Fig. 2). This IAM-like component is observed mainly in modern
North African individuals, following a west-to-east cline, and in
the Guanches.


quote:Where are you seeing this? I see the old language
Originally posted by Elmaestro:
I realized that there is a complete tonal shift in how the authors are describing the IAM. lol. No more of that "closest to the near east" bullshit.. They actually point out that Horners are the closest to the IAM. The Fst scores look like I expected them to, however I must admit I am surprised that he IAM are that close to Taforalt.
quote:Serious logical fallacy to compare that many populations to MOTA.
This suggests that most of IAM ancestry originates from an out-of-Africa source, as IAM
217 shares more alleles with Levantines than with any sub-Saharan Africans, including the
peer-reviewed) is the author/funder. It is made available under a CC-BY-NC-ND 4.0 International license.
bioRxiv preprint first posted online Sep. 21, 2017; doi: http://dx.doi.org/10.1101/191569. The copyright holder for this preprint (which was not
10
4,500-year-old genome from Ethiopia14
![[Big Grin]](biggrin.gif)
quote:But Maestro its such a great model for ethnocentric bias.
Originally posted by Elmaestro:
^there's one link in the op and I posted the supp above.
the study has been peer reviewed and published...
the preprint has become obsolete ..let it die.
Study OP
Supp

quote:Not only ethnocentric bias, it is a lie. There is no archaeological data supporting a back migration. All the evidence points to Africans carry culture into Iberia, the steppes and etc. I discuss this material in my recent paper Y-CHROMOSOME R1 WAS INTRODUCED TO EURASIA BY KUSHITES web page. It is sad that Geneticist perpetuate lies to manufacture a European influence over history that they never had, so as to promote white Supremacy.
Originally posted by Fourty2Tribes:
quote:But Maestro its such a great model for ethnocentric bias.
Originally posted by Elmaestro:
^there's one link in the op and I posted the supp above.
the study has been peer reviewed and published...
the preprint has become obsolete ..let it die.
Study OP
Supp
quote:
Originally posted by xyyman:

quote:
Originally posted by Qward:
Thanks for the links to the study.
Here's my attempt to make the first image Elmaestro posted clearer.

quote:https://s22.postimg.cc/9b9jxpzgx/U6_in_YAM-_African.jpg
Originally posted by the lioness,:
^ priorites


quote:Me or gramps? Don't know what you mean..
Originally posted by the lioness,:
^ priorites
quote:comment for xyyman, he was showing his priorities
Originally posted by Swenet:
quote:Me or gramps? Don't know what you mean..
Originally posted by the lioness,:
^ priorites
quote:
Originally posted by Elmaestro:
[Q] The genomes are being uploaded as we speak,
[/Q]
quote:Here you go
Originally posted by xyyman:
where? Link
quote:
Originally posted by Elmaestro:
The genomes are being uploaded as we speak,
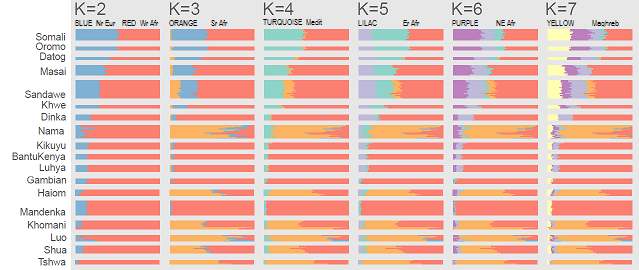
quote:Gambians (and to a lesser extent Mandenka) can be modelled with minor Iberomaurusian (or other North African) admixture in Global25. OTOH Skoglund et al modelled Gambians as 100% Mende with no PPNB (assuming they're the same samples), and in this study's ADMIXTURE they have almost no yellow component (Mandenka have more). Gambians have some E-M35 (including M78 and L19), plus their northern location, I'm guessing they have minor North African ancestry which Yoruba don't. The wild card is the Basal African/West African archaic thing.
Originally posted by Elmaestro:
Sidenote* Gambians seems to show the strongest signals... as opposed to YRI
quote:I picked up on a lot of this, (with the exception of the Global 25 stuff) There's definately a lot of prehistory masked by both the homogeneity of "OOAs" and the recombination of very divergent ancestry. I was able to squeeze out some wierd admixture signals dating towards the holocene for YRI using the 700yo pemba (one of the eldest W.African-lke specimen)
Originally posted by capra:
quote:Gambians (and to a lesser extent Mandenka) can be modelled with minor Iberomaurusian (or other North African) admixture in Global25. OTOH Skoglund et al modelled Gambians as 100% Mende with no PPNB (assuming they're the same samples), and in this study's ADMIXTURE they have almost no yellow component (Mandenka have more). Gambians have some E-M35 (including M78 and L19), plus their northern location, I'm guessing they have minor North African ancestry which Yoruba don't. The wild card is the Basal African/West African archaic thing.
Originally posted by Elmaestro:
Sidenote* Gambians seems to show the strongest signals... as opposed to YRI
code:I was able to see some decent curves when mixing Ancient Near easterners and Taofralt with pemba However the tests failed (Jackknife)Source1;Source2 amp (Z) time in Generations (z)
RESULT_1 Mota;Tanzania_Pemba_700BP 0.000154805 +/- 4.81939e-05 (Z=3.21213) 234.581 +/- 45.6366 (Z=5.14019)
RESULT_1 WHG;Tanzania_Pemba_700BP 0.000162835 +/- 5.16218e-05 (Z=3.15438) 234.581 +/- 45.6366 (Z=5.14019)
code:Pemba_700bp + the following created great curves:*** Computing 2-ref weighted LD with weights WHG Tanzania_Pemba_700BP ***
analyzing chrom 1 3 2 4 8 7 6 5 12 11 10 9 16 15 20 13 14 19 17 18 21 22
==> Time to run alder: 0.406488
+6.0e-05
|
|
|
|
| x
|
|
|
| x
|
|
|
|
|
|
|
| x
| x
| x
| x x x
| x x x x
| x x x x xxx
| x
| x x x xx
| x x
| x
| x
| x x x
| x xx x x x x x x
+---------+---x---x-+---------+---------+-----x---+-----x---+---------+--------
| 1 2 3 x 4 5 6 7 cM
| x x x
| x x x x
| x x
| x x xx x x x x x
| x
|
| x x x
|
| x x x
| x
| x
| x
****Successful
*** Computing 2-ref weighted LD with weights Taforalt Tanzania_Pemba_700BP ***
analyzing chrom 1 3 4 2 8 7 6 5 12 11 9 10 16 20 13 15 14 17 19 18 21 22
==> Time to run alder: 0.244233
+9.0e-05
|
|
|
| x
|
|
|
|
|
| x
|
|
|
| x
|
|
| x x
| x x
| x
| x x x
| x x x
| x
| x
| x x
| x x x x x x x
| x x
| x
| x x x
| x x x x
+---------+---------+---------+------x--+---------+----x----+------x--+--------
| 1 x2 3 4x 5 6 x 7 x xxcM
| x x x
| x x
| xxx x x x x
| x
| x x x x x x x
| x
| x x x
| x
| x
| x
|
| x
******Failed
quote:...It's coming together piece by piece. There has to be some consistency with FST scores. No way Taforalt and IAM should be more distant to YRI than Natufian right?
To follow up on my last post, some d-stats...
Mbuti/South_Africa_2000BP/Chimp Yoruba Mota Bichon
- hhuuuugelly postitive
Mbuti/South_Africa_2000BP/Chimp Mota Yoruba Bichon
- again hugely positive
These two stats suggest either Mota or Yoruba is a mix of two streams of ancestry, a basal one and one closer to the OOA node.
quote:Now look where we're at... posted on Anthrogenica
If A is Modern Africans B is Mena (Modern) and C is every other Modern Eurasian, can we still consider AB Eurasian??
we know B and C will undoubtedly be closer today.
Black lines are drift, red lines are admixture and X represents a single or multiple EARLY population offshoots.....
quote:It's basically a less nuanced version of what I've been trying to propose for months...if not years elsewhere.
Originally posted by Elite Diasporan:
@Elmaestro
I like this graph from that anthrogenica link.
https://anthrogenica.com/attachment.php?attachmentid=24022&d=1529080224
I see you guys moved to Anthrogenica and bushed FBD.
quote:The finding that early Neolithic Moroccans (as represented by IAM) show mostly continuity with Taforalt (including the sizable SSA component) does put a damper on the Eurocentric scenario that Neolithic North Africans were primarily descended from a wave of Near Eastern back-migrants, doesn't it?
Originally posted by Elmaestro:
Anyone remember when that boy Polako(ithink thats how you spell it) Said the taf was replaced by the IAM who are incoming neolithic population from the Near east lmaooo..
quote:.
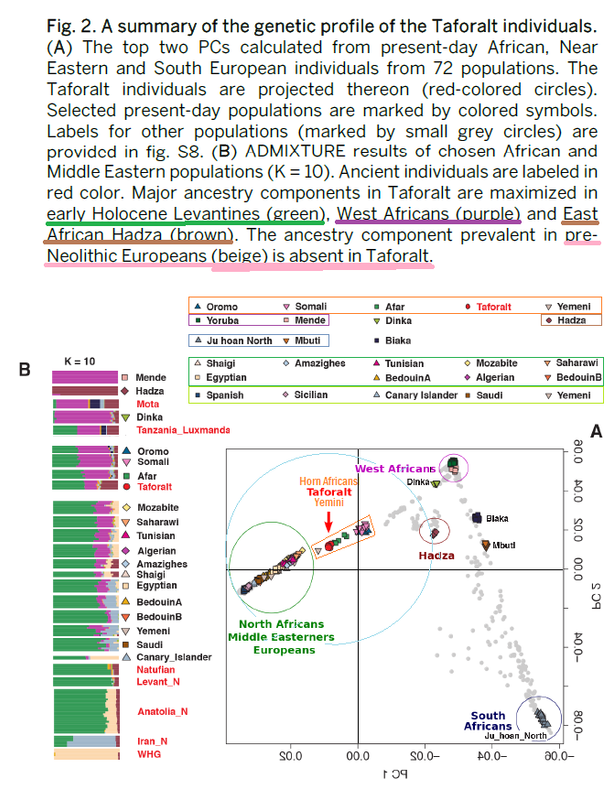
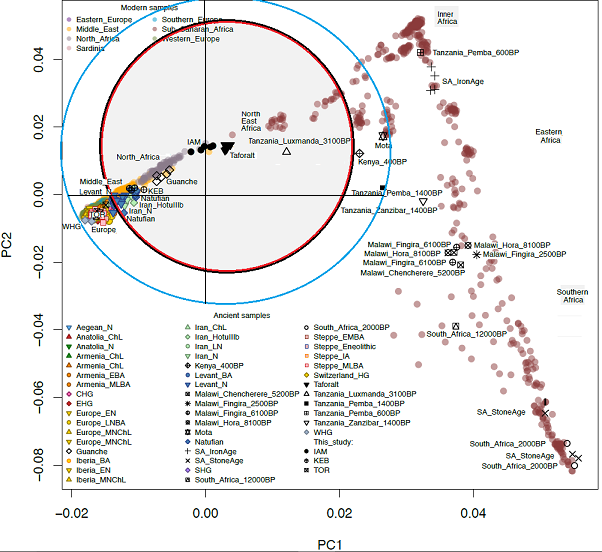
Fregel's HOD PCA S6.3 plots
• Taforalt closer to SSA than to Natufian
• Natufian overlaying Neolithic Iran
• Neolithic Iran overlayed by KEB
• Taforalt closer to Luxmanda than to Natufian
• Pemba 3X farther from Taforalt than Luxmanda is.
Consider the relative worth of PCA vs other analytic tools.
![[Big Grin]](biggrin.gif)
quote:
Originally posted by Elmaestro:
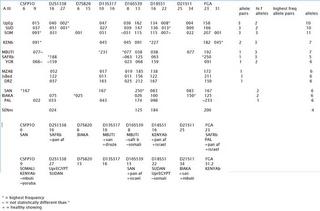
Xyyman, If you've figured out a way to genotype STR Go ahead and do IAM_5... that sample has a handful of reads viable for CODIS.
quote:Even just the 8 MiniFiler values will do.
Originally posted by Tukuler:
Please list the AmpFLSTR values.
quote:Thanks for drawing my attention to that.
Originally posted by Tukuler:
Fregel's HOD PCA S6.3 plots
• Taforalt closer to SSA than to Natufian
• Natufian overlaying Neolithic Iran
• Neolithic Iran overlayed by KEB
• Taforalt closer to Luxmanda than to Natufian
• Pemba 3X farther from Taforalt than Luxmanda is.
Consider the relative worth of PCA vs other analytic tools.
quote:Sure. Please comment further with any observations
Originally posted by Swenet:
quote:Thanks for drawing my attention to that.
Originally posted by Tukuler:
Fregel's HOD PCA S6.3 plots
• Taforalt closer to SSA than to Natufian
• Natufian overlaying Neolithic Iran
• Neolithic Iran overlayed by KEB
• Taforalt closer to Luxmanda than to Natufian
• Pemba 3X farther from Taforalt than Luxmanda is.
Consider the relative worth of PCA vs other analytic tools.
quote:
Originally posted by Tukuler:
Compare Loosdrecht's PCA, with PC1 flipped, to Fregel.
Radar ID
quote:Can you reduce the width of this image to under 800 please?
Originally posted by Tukuler:
Why STRS? Because they're powerful and what they
indicate is used everyday in courts everywhere.
No fancy higher math or special programs needed.
What 8 STRs can do
http://i66.tinypic.com/344s3l5.jpg
Write up @
http://www.egyptsearch.com/forums/ultimatebb.cgi?ubb=get_topic;f=8;t=009335;p=21#001004
quote:
Originally posted by Swenet:
Also see the preprint supps for the missing PC3 and PC4. The latter two PCs seem to have been deleted from the paper. They show modern SSA groups as intermediate between WHG and EHG on the one hand and IAM on the other hand. As gramps likes to say.. tic toc. lol.

quote:
Redux of post by Swenet:
Here is my take on PC3 and PC4.
The lower left corner is correlated with African ancestry.
no Mesolithic Eurasian clusters there.
after the Mesolithic W Euras appear in the center and lower left corner,
where Africans are
(the transparent burgundy/bordeaux circles, the black circles and the grey circles).
some type of ancestry uncommon in preHolocene W Europe
drives these samples away from their own Mesolithic ancestors.
Since Africans dominate the lower left corner, and
since this corner is opposite of
the righthand relatively 'pure' Eurasians corners,
the former corresponds to African ancestry.
WHG, SHG and EHG vary in their degree toward Africans.
not expected in a single OOA scenario,
with no further African input until the holocene.
some more common postMesolithic type(s) of African ancestry in W Eura
were present during the Mesolithic, as a small component.
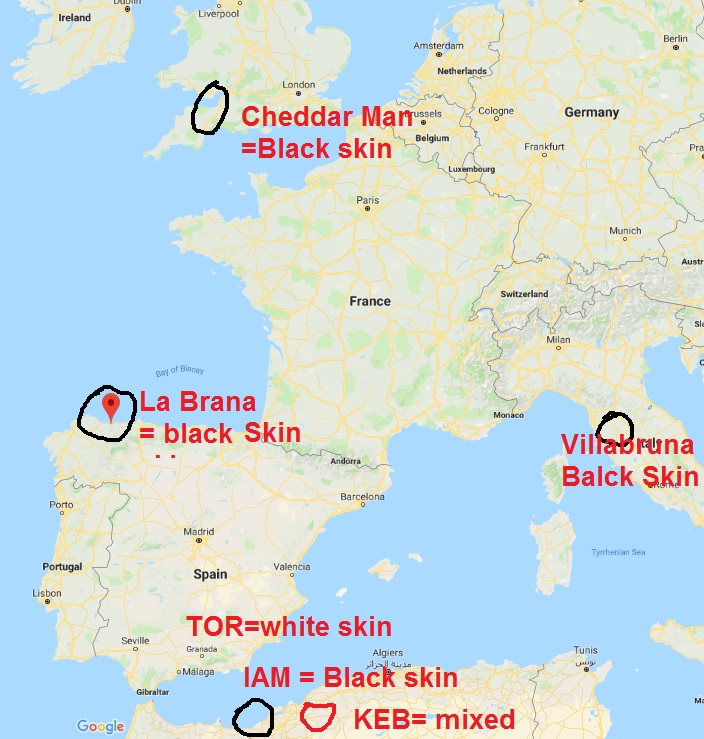
This is where the whole conversation about WHG/Cheddar Man etc. having African ancestry comes into the picture.
What piques my interest
SSAs are in the center, along with modern West Eurasians
(not in the lower left corner, with IAM).
could mean that
SSA populations brought Eurasians to the center,
N Afric samples brought Eurasians to the center, or both (in various OOA migrations).
Now ask yourself why PC3 and PC4 with SSA samples are rarely included in aDNA papers.Even in this paper (Fregel et al), PC3 and PC4 only seem to appear in the preprint, but not in the final paper.
quote:About that graph. Wouldn't this mean that some SSA are closer to some Europeans than they are to each other? Eastern Europeans cluster with SSA before they do southern Europeans?
quote:Yes. The higher PCs remind me of TREEMIX residuals in that they don't explain as much of the data, but are needed for the full picture. I find it interesting that they're systematically left out in genetics papers. There is not even a passing mention that they're not shown.
Originally posted by Tukuler:
Big bite to chew. Hope I got the gist of it. (below)
Africans rarely show in Euro freq representations.
We know they have to be there. Overlooked tools
like PCA's 3'4 sets can uncover 'back-burnered'/
'hidden' African affinity.
Oh, what's your axis coordinate(s)? 0.035?
Solid math quads or looser overlapping 'ethnic' sectors.
A bit of both and knowing when to apply which.
Ah, PCA - no tool like an old tool.
Newer tool f4 comin atchas.
quote:
Redux of post by Swenet:
Here is my take on PC3 and PC4.
The lower left corner is correlated with African ancestry.
no Mesolithic Eurasian clusters there.
after the Mesolithic W Euras appear in the center and lower left corner,
where Africans are
(the transparent burgundy/bordeaux circles, the black circles and the grey circles).
some type of ancestry uncommon in preHolocene W Europe
drives these samples away from their own Mesolithic ancestors.
Since Africans dominate the lower left corner, and
since this corner is opposite of
the righthand relatively 'pure' Eurasians corners,
the former corresponds to African ancestry.
WHG, SHG and EHG vary in their degree toward Africans.
not expected in a single OOA scenario,
with no further African input until the holocene.
some more common postMesolithic type(s) of African ancestry in W Eura
were present during the Mesolithic, as a small component.
This is where the whole conversation about WHG/Cheddar Man etc. having African ancestry comes into the picture.
What piques my interest
SSAs are in the center, along with modern West Eurasians
(not in the lower left corner, with IAM).
could mean that
SSA populations brought Eurasians to the center,
N Afric samples brought Eurasians to the center, or both (in various OOA migrations).
Now ask yourself why PC3 and PC4 with SSA samples are rarely included in aDNA papers.Even in this paper (Fregel et al), PC3 and PC4 only seem to appear in the preprint, but not in the final paper.
quote:Just two? Remember that Fst data shows YRI distance to Eurasians keeps lowering over time. It never stabilizes, nor does it ever reverse in any era. The first West Eurasian OOA migrants tend to be most distant, while modern West Eurasians tend to be the closest to YRI. All aDNA is somewhere in between, with Bronze Age West Eurasians tending to be the next in line in terms of closeness to YRI in terms of Fst. This leads to interesting comparisons where Yamnaya might be closer to YRI than they are to some eastern Asians, Fst-wise. This is very hard to explain without continuous OOA migrations.
Originally posted by xyyman:
Indicative of TWO OOA. Last being the early Neolithic/Holocene. That’s why modern SSA and West Eurasian cluster
WHG/SHG/EHG were part of ONE/First OOA taking different routes. With Africa being the central point of dispersion. In other words the migration path was not through the Levant or Horn for all. Eg WHG dispersed through either Canary Island/Gibraltar. Holocene Africans left may be about 20years later.
Quote:
“WHG, SHG and EHG vary in their degree toward Africans.
not expected in a single OOA scenario,
with no further African input until the Holocene. SSAs are in the center, along with modern West Eurasians”

quote:We might be miscommunicating. This is what I meant when I said researchers are often leaving out PCA information:
Originally posted by Tukuler:
@ Swenet
I cut the quantifiers out of the summary
because I don't find it necessary since
who talks in absolutes. There's no
absolute "all". An unmeasured subset is
assumed when talking about a people.

quote:You said something about that coordinate. Can you clarify what you meant?
But what about the questions I had about
your comments and analysis of Fregel's
Afr aDNAless preprint PCA 3'4?
quote:The key part:
Y-chromosome and mtDNA lineages are generally highly differentiated between continents, making them powerful genetic markers of intercontinental migration. Most of the lineages that are characteristic of sub-Saharan Africa are absent in Europe (and vice versa) (Cavalli-Sforza and Feldman 2003; Underhill and Kivisild 2007). However, the coalescent time and geographic distribution of the Y-chromosome E3b (E-M215) haplogroup points to a late Pleistocene migration from Eastern Africa to Western Eurasia via the Nile Valley and Sinai Peninsula ∼20–25 KYA (Cruciani et al. 2004, 2007; Luis et al. 2004). However, these Y chromosomes are concentrated in southern Europe (Cruciani et al. 2004), whereas the smaller average divergence times between Europe and Africa relative to East Asia and Africa are still readily apparent across each individual northern European sample population (Supplemental Table 2). This suggests that the discrepancy has, at least partially, an even earlier and more pervasive origin, being established prior to the appearance, and consequent migration tagging ability, of the current range of mtDNA and Y-chromosome haplogroups.
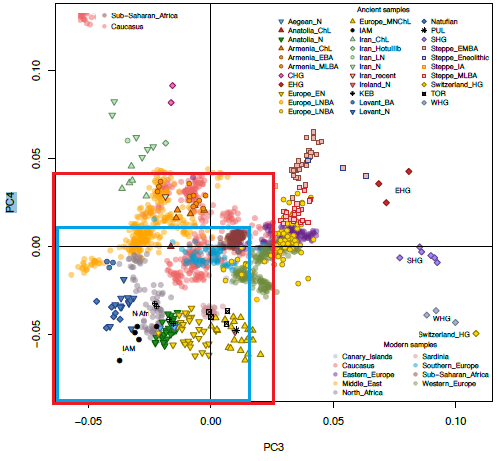
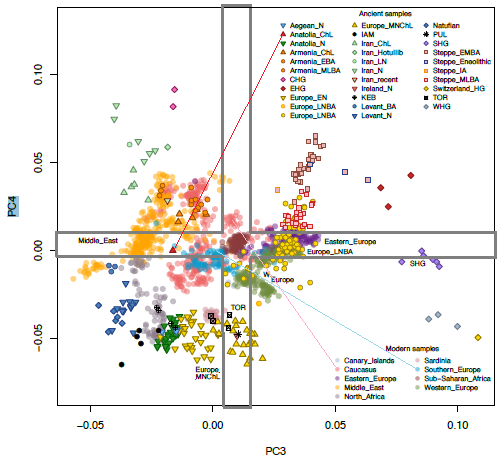
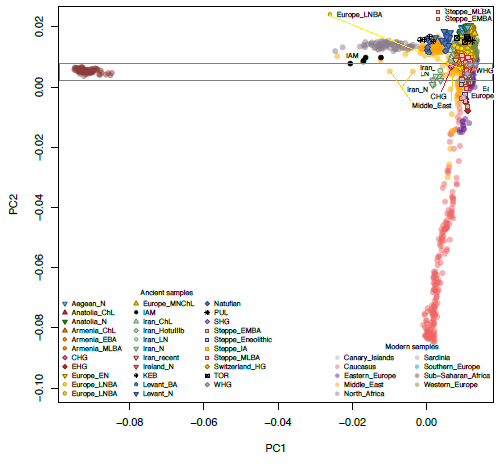
quote:I would make the lower left corner even smaller than both squares, since technically, a corner in PCA would be (strongly) positive or negative. Your red and blue squares include some positive and intermediate, in addition to negative. But I guess in the end it doesn’t matter how one defines the North African-associated lower left corner. Both of your red and blue squares mark PC space that is decidedly not Eurasian. Eurasians only start to appear there late in their history (after the Mesolithic). So, since it's not Eurasian, anyway, both of your squares can be considered the 'non-Eurasian corner'. Even the SSA samples in the center are capable of contributing to Holocene Eurasian ending up in the middle and lower left--not just samples like IAM in the lower left corner. Although, out of the IAM sample and the SSA shown in PC3+PC4, only admixture with IAM-like populations is capable of dragging West Eurasians as far lower left as Natufians, Levantine farmers and European farmers are. Admixture with this SSA sample won’t cause that, since it doesn’t have a negative position to exercise that much of a pulling effect in PC3+PC4. At best, it can contribute to Holocene West Eurasian samples being in the center of PC3+PC4, and away from SHG, WHG and EHG, which I’m sure SSA ancestry did. Lastly, I think more pure North African samples yet to be sampled will occupy PC3+PC4's empty space in the lower left corner where only one IAM individual ventured. That is my take on PC3+PC4.
Originally posted by Tukuler:
Just trying to be sure.
Didn't know if your
center and lower left corner
was the red or blue square?
Maybe neither? Also, I had to
zoom deep to tell SSA color
from Caucasus, legend in upper left.
quote:Agree. Whatever is captured by this PCA's PC2, the SSA samples are most similar to Iranians and WHG, while IAM is most similar to Mediterranean farmers.
Originally posted by Tukuler:
The preprint PC1'2 w/o Afr aDNA
places all Inner Africans way off
on their own. But Afr PC2 'horizon'
reveals who shares those secondary
element set precise sub-components.
quote:~Pinhasi, R. et al.

“The site has been directly dated to 9650)9950 calBP (11), showing intense occupation over two to three centuries. The economy of the population has been shown to be that of pastoralists, focusing on goats (11). Archaeobotanical evidence is limited (16) but the evidence present is for two)row barley, probably wild, and no evidence for wheat, rye or other domesticates. In other words the overall economy is divergent from the classic agricultural mode of cereal agriculture found in the Levant, Anatolia and Northern Mesopotamian basin.
[...]
We compared GD13a with a number of other ancient genomes and modern populations (6, 17–29), using principal component analysis (PCA) (30), ADMIXTURE (31) and outgroup f3 statistics (32) (Fig. 1). GD13a did not cluster with any other early Neolithic individual from Eurasia in any of the analyses. ADMIXTURE and outgroup f3 identified Caucasus Hunter)Gatherers of Western Georgia, just north of the Zagros mountains, as the group genetically most similar to GD13a (Fig. 1B&C), whilst PCA also revealed some affinity with modern Central South Asian populations such as Balochi, Makrani and Brahui (Fig. 1A and Fig. S4). Also genetically close to GD13a were ancient samples from Steppe populations (Yamanya & Afanasievo) that were part of one or more Bronze age migrations into Europe, as well as early Bronze age cultures in that continent (Corded Ware) (17, 23), in line with previous relationships observed for the Caucasus Hunter)Gatherers (26).
[...]
Figure Legends:
Fig. 1. GD13a appears to be related to Caucasus Hunter Gatherers and to modern South Asian populations.
A) PCA loaded on modern populations (represented by open symbols). Ancient individuals (solid symbols) are projected onto these axes.
B) Outgroup f3(X, GD13a; Dinka), where Caucasus Hunter Gatherers (Kotias and Satsurblia) share the most drift with GD13a. Ancient samples have filled circles whereas modern populations are represented by empty symbols.
C) ADMIXTURE using K=17, where GD13a appears very similar to Caucasus Hunter Gatherers, and to a lesser extent to modern south Asian populations.
http://oi63.tinypic.com/e8r4nk.jpg (http://oi63.tinypic.com/e8r4nk.jpg)
http://oi65.tinypic.com/24zap2b.jpg (http://oi65.tinypic.com/24zap2b.jpg)
[...]
S4. Mitochondrial Haplogroup Determination
The mitochondria of GD13a (91.74X) was assigned to haplogroup X, most likely to the subhaplogroup X2. Haplogroup X2 is present in modern populations from Europe, the Near East, Western and Central Asia, North and East Africa, Siberia, and North America (7). Haplogroup X2 has been associated with an early expansion from the Near East (7, 8) and has been found in early Neolithic samples from Anatolia (9), Hungary (10) and Germany (11).”
[…]
S5. Principal component analysis shows that Southern Asian populations are the closest contemporary populations to the Iranian herder GD13a was placed close to the Southern Asian samples, specifically between the Balochi, Makrani and Brahui populations of South Asia. (Fig. S4). Of the ancient samples, GD13a falls closest to hunter-gatherers from the Caucasus (Fig. S4).
[…]
S7. Outgroup f3 statistics show that GD13a shares the most genetic drift with Caucasus Hunter-gatherers
We used outgroup f3-statistics to estimate the amount of shared drift between GD13a and contemporary populations. This was performed on the dataset described in section S6 using the qp3Pop program in the ADMIXTOOLS package (13). We computed f3(X, GD13a; Dinka), where X represents a modern population and Dinka, an African population equally related to Eurasians, acts as an outgroup (Fig. S7). We also repeated this analysis where X represents ancient individuals/populations. Among the ancient populations, Caucasus hunter-gatherers (Kotias and Satsurblia) have the closest affinity to GD13a (Table S3), followed by other ancient individuals from Steppe populations from the Bronze age and modern populations from the Caucasus.
quote:~Marieke van de Loosdrecht
"For the Taforalt individuals to be considered as being Basal Eurasians, we expect that their genomes do not share significantly more alleles with the Neanderthal genome than that sub-
Saharan Africans do."