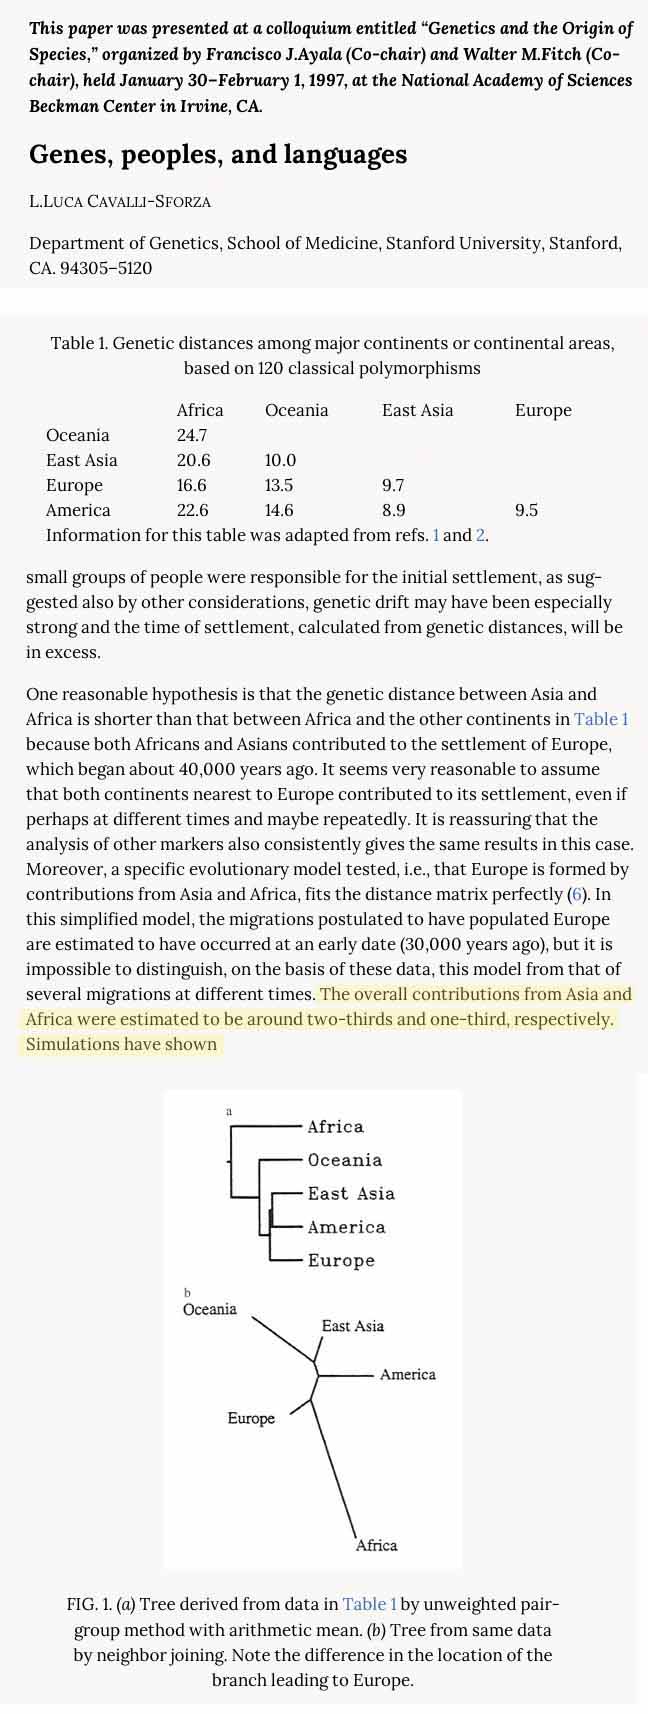
that is greatest genetic distance of the regions listed.
comparatively Europe distance from Africa 16.6
Now look at the tree chart (b) at the bottom that corresponds
but if you look at (a) it doesn't appear to, you have Oceania as first branch form Africa and the caption says "unweighted pairing group method with arithmetic mean"
What does that mean and why does it look like a different result.
xyyman Member # 13597
posted
You realize "classical polymorphism" stated by Sforza are essentially STR and not SNPs?
That is why McEvoy stated this.....After Eurasian divergence from Africans there was substantial subsequent flow of Africans to Western Europe. All these researchers knew this since the early days of genetics now they are trying to unravel it and create lies about "back-migration". STRs are the key because lack of recombination or mutation do NOT occur ie Linkage Disequilibrium (LD). THEY ALL KNEW THAT for a long time now.
---- McEvoy et al. Quote: , ***consistently*** demonstrate a significantly more recent relationship between Europe and Africa than between East Asia and Africa. Using simulated populations, we show that under the single-wave Out of Africa model, Thus, the observations are suggestive that GREATER MIGRATION TO EUROPE FROM SUB-SAHARAN AFRICAN HAS BEEN A LONG-TERM PHENOMENON.
Firstly, they suggest a substantial gap between African/Eurasian and West/East Eurasian divergence (;***20 KYA from TF estimates***), indicating an appreciable pause between leaving Africa and departure for East Eurasia. Secondly, they support further early gene flow to the remaining proto-West Eurasian population from Africa after Eurasian divergence, perhaps as a second smaller dispersal (Mellars 2006a).
Quote from Frege et al 2017: IAM(early Neolithic North Africans) people do ***NOT*** possess any of the European SNPs associated with light pigmentation, and most likely had dark(black) skin and eyes. IAM samples present ancestral alleles for pigmentation-associated variants present in SLC24A5 (rs1426654), SLC45A2 (rs16891982) and OCA2 (rs16891982 and 12913832) genes. On the other hand, KEB individuals exhibit ***some*** European- derived alleles that predispose individuals to lighter skin and eye colour, including those on genes SLC24A5 (rs1426654) and OCA2 (rs16891982) (Supplementary Note 11). ---
And Rosenberg and Lazardis and Sergi et al etc. postulated that Europeans are depigmented Africans.
Now Sforza stated the same thing. Europeans are closest genetically to Africans than all other continental groups.
I told you so.
the lioness, Member # 17353
posted
quote:Originally posted by xyyman: .After Eurasian divergence from Africans there was substantial subsequent flow of Africans to Western Europe.
when?
xyyman Member # 13597
posted
Yeah and to those who can follow. Arnaiz-Villens said the same thing. And he was criticized by his academic peers to even suggest this. It was considered blasphemy by the European elite academics and he was balcklisted.
Villens made it clear that African Berbers are closely related to Europeans and they were ancestral to Europeans except for the Greeks and a few other European population. Greeks are closely related to "directly" to Sub-saharans WITHOUT Berber intervention. As I said the Nile/Eastern Sahara seems to the line of demarcation. " Libyans " to the West and "Ethiopians" to the East.
the lioness, Member # 17353
posted
quote:Originally posted by the lioness,: [QB] [QUOTE]Originally posted by xyyman: .After Eurasian divergence from Africans there was substantial subsequent flow of Africans to Western Europe.
when?
xyyman Member # 13597
posted
When?
I have read so many papers that I have lost count but indication are there were TWO major migrations. First, about 15-30,000years ago of which WHG are part of. Then between 5-10000 years ago the Neolithics entered. EEF/BE. There appears to be a minor migration about 3000years ago but it is still not clear. This brought to dominance R1b-M269. It was not from the Steppes I am speculating An Island off the coast of Africa. Balearic Islands or Canary Islands? This was male dominated for some reason. If these European researchers were more forthcoming we would know. But they are hell bent on lies and deception.
xyyman Member # 13597
posted
To those who are NOT geographically and chronologically challenged they would realize that the ancient Canary Islanders carried R1b long before supposed "Spanish contact". Latitudinally Canary Island is West African!!! R1b was also found in ancient Ireland, again, a Western land mass in the Atlantic. The Basque has an extremely High Frequency of R1b. Following the IBD model R1b could have a Sahara origin!!! But based upon markers from ancient North Africans(IAM) and lack of R1b I would think the R1b was the last major migration occurring about 1-3000 BC. Why without females? That is strange. I speculate a female "mediated" society.
Elmaestro Member # 22566
posted
quote:Originally posted by the lioness,: table 1 says
Oceania distance from Africa 24.7
that is greatest genetic distance of the regions listed.
comparatively Europe distance from Africa 16.6
Now look at the tree chart (b) at the bottom that corresponds
but if you look at (a) it doesn't appear to, you have Oceania as first branch form Africa and the caption says "unweighted pairing group method with arithmetic mean"
What does that mean and why does it look like a different result.
Look at Table one. You'll notice that distances from all populations follow a trend, Africa with the most, Oceania, East Asia, America, then Europe. Because Europe has such relatively low distances due to low diversity (or Drift) every one else will appear closer, followed by American, then East Asia and so forth. This pairing is unweighted because the averages weren't adjusted for that phenomenon. So that first tree fig1(a) can visually represent a baseline for when each population diverged based on drift but it'll reflect poorly on admixture or gene-flow between groups.
the lioness, Member # 17353
posted
quote:Originally posted by Elmaestro
Look at Table one. You'll notice that distances from all populations follow a trend, Africa with the most, Oceania, East Asia, America, then Europe. Because Europe has such relatively low distances due to low diversity (or Drift) every one else will appear closer, followed by American, then East Asia and so forth. This pairing is unweighted because the averages weren't adjusted for that phenomenon. So that first tree fig1(a) can visually represent a baseline for when each population diverged based on drift but it'll reflect poorly on admixture or gene-flow between groups. [/QB]
Your are reading that table wrong It is not a table indicating diversity Europe has the least genetic distance to Africa, therefore is closest to Africa on the chart
Elmaestro Member # 22566
posted
quote:Originally posted by the lioness,:
quote:Originally posted by Elmaestro
Look at Table one. You'll notice that distances from all populations follow a trend, Africa with the most, Oceania, East Asia, America, then Europe. Because Europe has such relatively low distances due to low diversity (or Drift) every one else will appear closer, followed by American, then East Asia and so forth. This pairing is unweighted because the averages weren't adjusted for that phenomenon. So that first tree fig1(a) can visually represent a baseline for when each population diverged based on drift but it'll reflect poorly on admixture or gene-flow between groups.
Your are reading that table wrong It is not a table indicating diversity Europe has the least genetic distance to Africa, therefore is closest to Africa on the chart [/QB]
wasn't your question about fig a?
"comparatively Europe distance from Africa 16.6
Now look at the tree chart (b) at the bottom that corresponds
but if you look at (a) it doesn't appear to, you have Oceania as first branch form Africa and the caption says "unweighted pairing group method with arithmetic mean"
--What does that mean and why does it look like a different result."--
I literally explained in the simplest way from the ground up to you why Oceana is closest to Africa in figure a.
the lioness, Member # 17353
posted
quote:Originally posted by Elmaestro:
quote:Originally posted by the lioness,:
quote:Originally posted by Elmaestro
Look at Table one. You'll notice that distances from all populations follow a trend, Africa with the most, Oceania, East Asia, America, then Europe. Because Europe has such relatively low distances due to low diversity (or Drift) every one else will appear closer, followed by American, then East Asia and so forth. This pairing is unweighted because the averages weren't adjusted for that phenomenon. So that first tree fig1(a) can visually represent a baseline for when each population diverged based on drift but it'll reflect poorly on admixture or gene-flow between groups.
Your are reading that table wrong It is not a table indicating diversity Europe has the least genetic distance to Africa, therefore is closest to Africa on the chart
wasn't your question about fig a?
"comparatively Europe distance from Africa 16.6
Now look at the tree chart (b) at the bottom that corresponds
but if you look at (a) it doesn't appear to, you have Oceania as first branch form Africa and the caption says "unweighted pairing group method with arithmetic mean"
--What does that mean and why does it look like a different result."--
I literally explained in the simplest way from the ground up to you why Oceana is closest to Africa in figure a. [/QB]
Ok my apologies
I think I did read. Somewhere that Papuans had high genetic diversity Also could look at it as populations who left Africa in an earlier migration, maybe, more time fir diversity to occur
Swenet Member # 17303
posted
Sometimes dendrograms show samples as outgroups (in this case Oceanians have an outgroup position relative to Eurasians). This means they will be shown as occupying a basal position among closely related peers.
This is a normal feature of all dendrograms and doesn't have to reflect something real. Individual dendrgrams reflect only part of the affinities, not the full picture. Like I said, that is part of how they work.
Swenet Member # 17303
posted
quote:The Badarian series clusters with the tropical African groups no matter which algorithm is employed (see Figures 3 and 4). The clustering with the Bushman can be understood as an artifact of grouping algorithms; it is well known that a series may group into a cluster that does not contain the series to which it is most similar (has the lowest distance value).

 posted